The Methane Fee was created by the Inflation Reduction Act of 2022 (IRA). The IRA added a new Section 136 to the Clean Air Act (CAA) that set up the “Methane Emissions and Waste Reduction Incentive Program for Petroleum and Natural Gas Systems” and instructed the EPA to issue rules to calculate the charge and determine who qualifies for exemptions offered by the IRA.
Waste Emissions Fee (WEC) Explained
The EPA’s proposed Methane Emissions Reduction Program could create substantial new annual costs for the oil and gas sectors starting in March 2025. In its Proposed Rule, the EPA explains how sources should estimate their asset’s emissions limit that triggers the per-ton charge for emissions above that limit. The new fee applies to nine categories of “applicable facilities” reporting more than 25,000 metric tons of carbon dioxide equivalent (CO2e) of greenhouse gas emissions under EPA’s Greenhouse Gas Reporting Rule, found in 40 CFR Subpart W:
- offshore petroleum and natural gas production
- onshore petroleum and natural gas production
- onshore natural gas processing
- onshore natural gas transmission compression
- underground natural gas storage
- liquified natural gas (LNG) storage
- LNG import and export equipment
- onshore petroleum and natural gas gathering and boosting
- onshore natural gas transmission pipelines
The statute defines three different levels for “applicable facilities” to determine the quantity of excess emissions used to compute the charge, mainly based on the proportion of natural gas delivered to a sales line or flowing through a facility.
Determine Your Facility Emissions Threshold
Based on the type of facility your operations qualify under, threshold calculations will be calculated based on the processing or production profile. The below table is the current data available from the EPA.
Emissions Threshold Used to Calculate Fee
| Facility Type |
Emission Standards |
| Onshore and offshore petroleum and natural gas production facilities |
Emissions that exceed 0.20% of natural gas sent to sale from the facility or 10 metric tons of methane per million barrels of oil sent to sale if no natural gas was sent to sale from the facility |
| Onshore natural gas processing, LNG storage, LNG import and export equipment, or onshore petroleum and natural gas gathering and boosting facilities |
Emissions that exceed 0.05% of the natural gas sent to sale “from or through” the facility |
| Onshore natural gas transmission compression, underground natural gas storage, or onshore natural gas transmission pipeline facilities |
Emissions that exceed 0.11% of the natural gas sent to sale “from or through” the facility |
The EPA gave an example of how to calculate a threshold for an onshore oil or gas production facility that reports emitting 3,000 metric tons of methane:
- Waste emissions threshold = throughput x segment-specific intensity x density of CH4
- Waste emissions threshold = 60,000,000 Mscf x 0.002 x 0.0192 mt/Mscf
- Waste emissions threshold = 2.304 mt CH4
The Cost of Methane
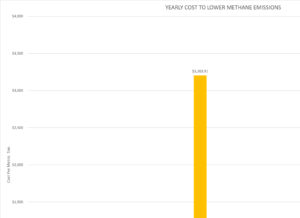
The fee structure for WEC will increase over the proposed schedule through 2027. Operators should be planning for 2025 reporting of 2024 emissions under their Subpart W – GHG Reporting program.
| Year |
Charge for Excess Emissions |
| 2025 |
$900 per ton above waste emissions threshold for 2024 emissions |
| 2026 |
$1,200 per ton above waste emissions threshold for 2025 emissions |
| 2027 and beyond |
$1,500 per ton above waste emissions threshold for the preceding year’s emissions |
Facilities must calculate and pay the WEC based on their emissions in the previous year by March 31, which coincides with the deadline for Subpart W annual reports to the EPA. For example, if the facility above emits 3,000 metric tons of methane in 2024, then it would surpass its threshold by 696 tons, and it would owe the EPA a $626,400 fee by March 31, 2025. EPA is seeking comments on whether the initial filing deadline should be delayed for the first reporting year.
This WEC structure on top of the new rules from 40 CFR Subpart OOOO – Subpart OOOO —Standards of Performance for Crude Oil and Natural Gas Facilities regarding methane venting will require operators to plan for increased spend on the reduction of methane emissions. To stay up to speed on other emission regulation developments, download our USA Emissions Whitepaper.
CANUSA EPC understands that this will be an important part of discussion with clients for capital planning and we will be developing processes and tools to help clients stay informed and navigate this changing regulatory environment. Venture over to our codes and standard whitepaper to read about emissions reduction regulations in your area of operations or use our emissions reduction calculator to start determining the return on your investment while reducing your methane emissions.
Explore more resources.
